I ran into an issue installing RMySQL on OSX. I am using a R from brew and MySQL from the Oracle download page. Trying to install RMySQL would throw up this error
Turns out that the right solution is really easy. Set your MySQL home R env var, make sure that libmysqlclient can be found by R, configure the RMySQL package with the proper inc & lib dirs for MySQL
Tests!
Showing posts with label R. Show all posts
Showing posts with label R. Show all posts
Saturday, October 5, 2013

Friday, April 5, 2013
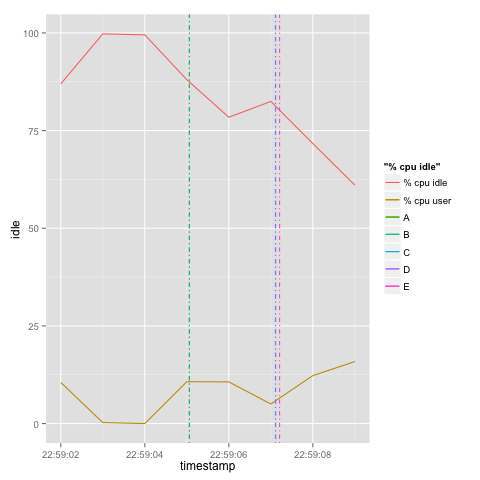
Vertical line markers in R using geom_vline
Say you have a two data sets that share a common dimension/axis only. Here's an example:
Here's a gist:
 Obviously, we need a better legend, y axis label and a title for this graph.. That's left as an exercise.
# Event csvYou'd like to plot these values on one graph; one overlaid over the other. Based on the data from the example above, you'd like to plot the CPU user against the timestamp metric, then you'd like to add in markers to show events over the chart.
timestamp,event
2013-04-03 22:59:05.061Z,A
2013-04-03 22:59:05.061Z,B
2013-04-03 22:59:07.109Z,C
2013-04-03 22:59:07.115Z,D
2013-04-03 22:59:07.209Z,E
# Performance data
hostname;interval;timestamp;CPU;user;nice;system;iowait;steal;idle
box1;1;2013-04-03 22:59:02 UTC;-1;10.53;0.00;2.01;0.50;0.00;86.97
box1;1;2013-04-03 22:59:03 UTC;-1;0.25;0.00;0.00;0.00;0.00;99.75
box1;1;2013-04-03 22:59:04 UTC;-1;0.00;0.00;0.25;0.25;0.00;99.50
box1;1;2013-04-03 22:59:05 UTC;-1;10.72;0.00;1.00;0.25;0.00;88.03
box1;1;2013-04-03 22:59:06 UTC;-1;10.67;0.00;10.67;0.00;0.25;78.41
box1;1;2013-04-03 22:59:07 UTC;-1;5.01;0.00;9.02;3.51;0.00;82.46
box1;1;2013-04-03 22:59:08 UTC;-1;12.28;0.00;11.53;4.26;0.25;71.68
box1;1;2013-04-03 22:59:09 UTC;-1;15.88;0.00;11.66;10.92;0.50;61.04
Here's a gist:
Tuesday, April 2, 2013
R and GFS.
Playing with NOAA's GFS data with R.


Credit:
- http://braz.blogspot.com/2009/
12/r-for-global-climate- forecasting.html - http://joewheatley.net/ncep-
global-forecast-system/


Pre-requisites
- Fetched data from NOAA (in particular this dataset).
- Installed wgrib2.
- Extracted the fields I was interested in from the grib2 file into netcdf
./grib2/wgrib2/wgrib2 -s gfs.t12z.sfluxgrbf03.grib2 | grep :LAND | ./grib2/wgrib2/wgrib2 -i gfs.t12z.sfluxgrbf03.grib2 -netcdf land.netcdf
./grib2/wgrib2/wgrib2 -s gfs.t12z.sfluxgrbf03.grib2 | grep TMP:2 | ./grib2/wgrib2/wgrib2 -i gfs.t12z.sfluxgrbf03.grib2 -netcdf temp2.netcdf
./grib2/wgrib2/wgrib2 -s gfs.t12z.sfluxgrbf03.grib2 | grep VEG: | ./grib2/wgrib2/wgrib2 -i gfs.t12z.sfluxgrbf03.grib2 -netcdf vegetation.netcdf
./grib2/wgrib2/wgrib2 -s gfs.t12z.sfluxgrbf03.grib2 | grep TCDC: | ./grib2/wgrib2/wgrib2 -i gfs.t12z.sfluxgrbf03.grib2 -netcdf cloud.netcdf
- You can also view the available fields using:
./grib2/wgrib2/wgrib2 -s gfs.t12z.sfluxgrbf03.grib2 | less
- Or by visiting the description.
Having fun
Started R and installed netcdf and fields:install.packages('ncdf')Then used the following gist in R.
install.packages('fields')
Thursday, March 28, 2013
Kenya DOB density plot
Here is a density plot of a sample of Kenyans based on their year of birth. It's interesting to see the dips correlate with turbulent times; political and military. In the diagram below, the largest unexplained dip is in the early 1970s. Anyone care to explain it; Google and Wikipedia don't return any results?
Click here for a larger image
EDIT:
Could it be the 1969 Kisumu incident?

Here is the code used to produce the graph in R
Subscribe to:
Posts (Atom)